 Risk Analysis Editor
 Risk analysis,
from inherent to residual
A standalone risk-analysis editor, built on a generic, configurable model: define your grid, enter risks and controls, and visualize the shift from inherent to residual risk – matrices, trajectories, action plan and report. The whole analysis fits in a single open .rae.json file.
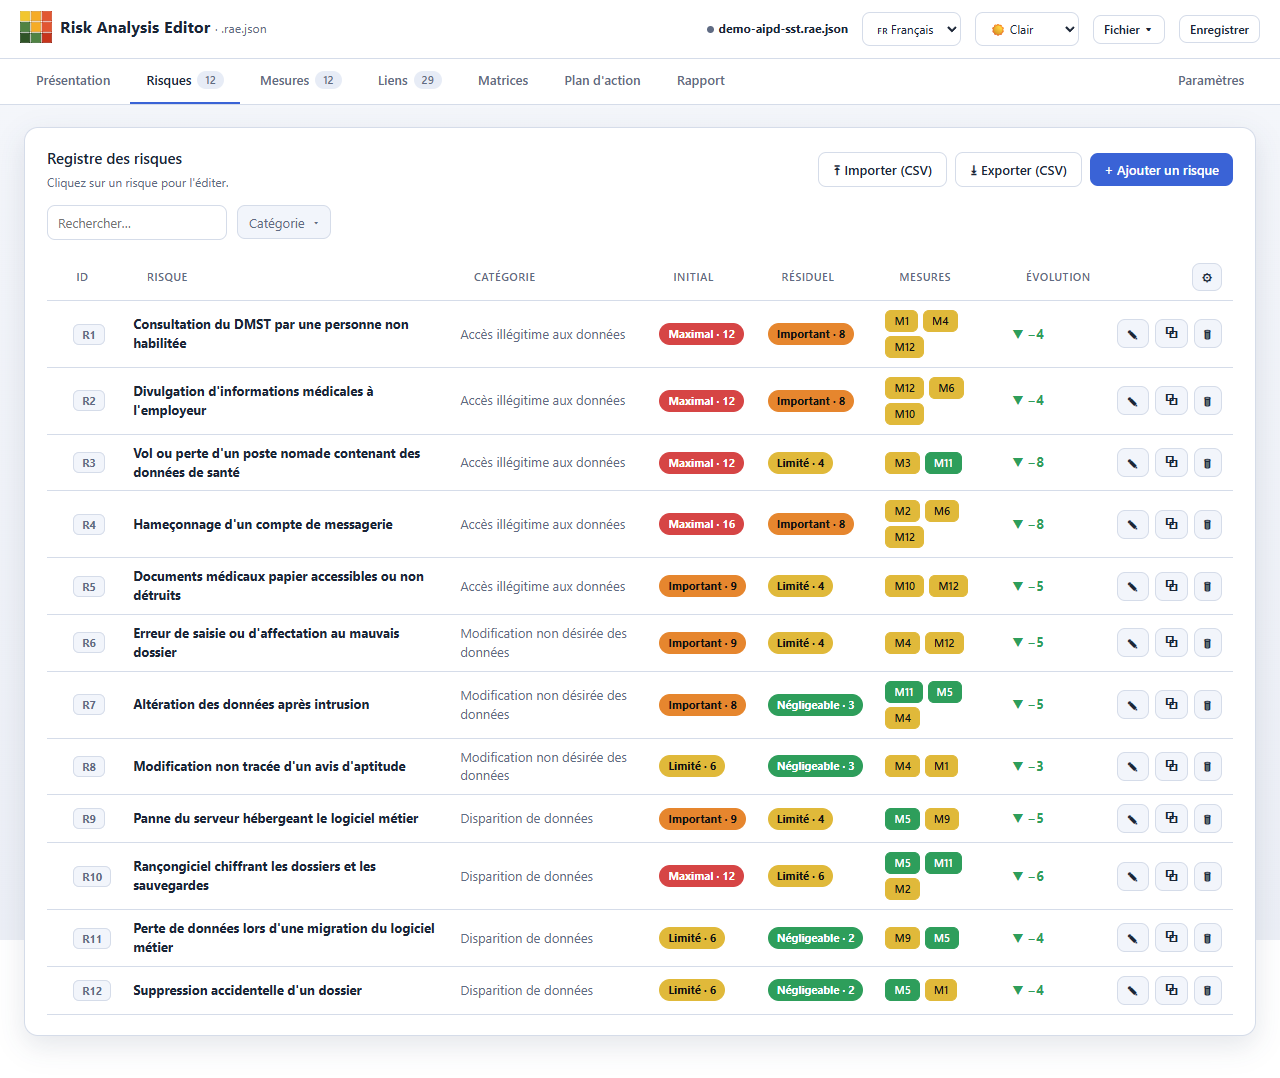
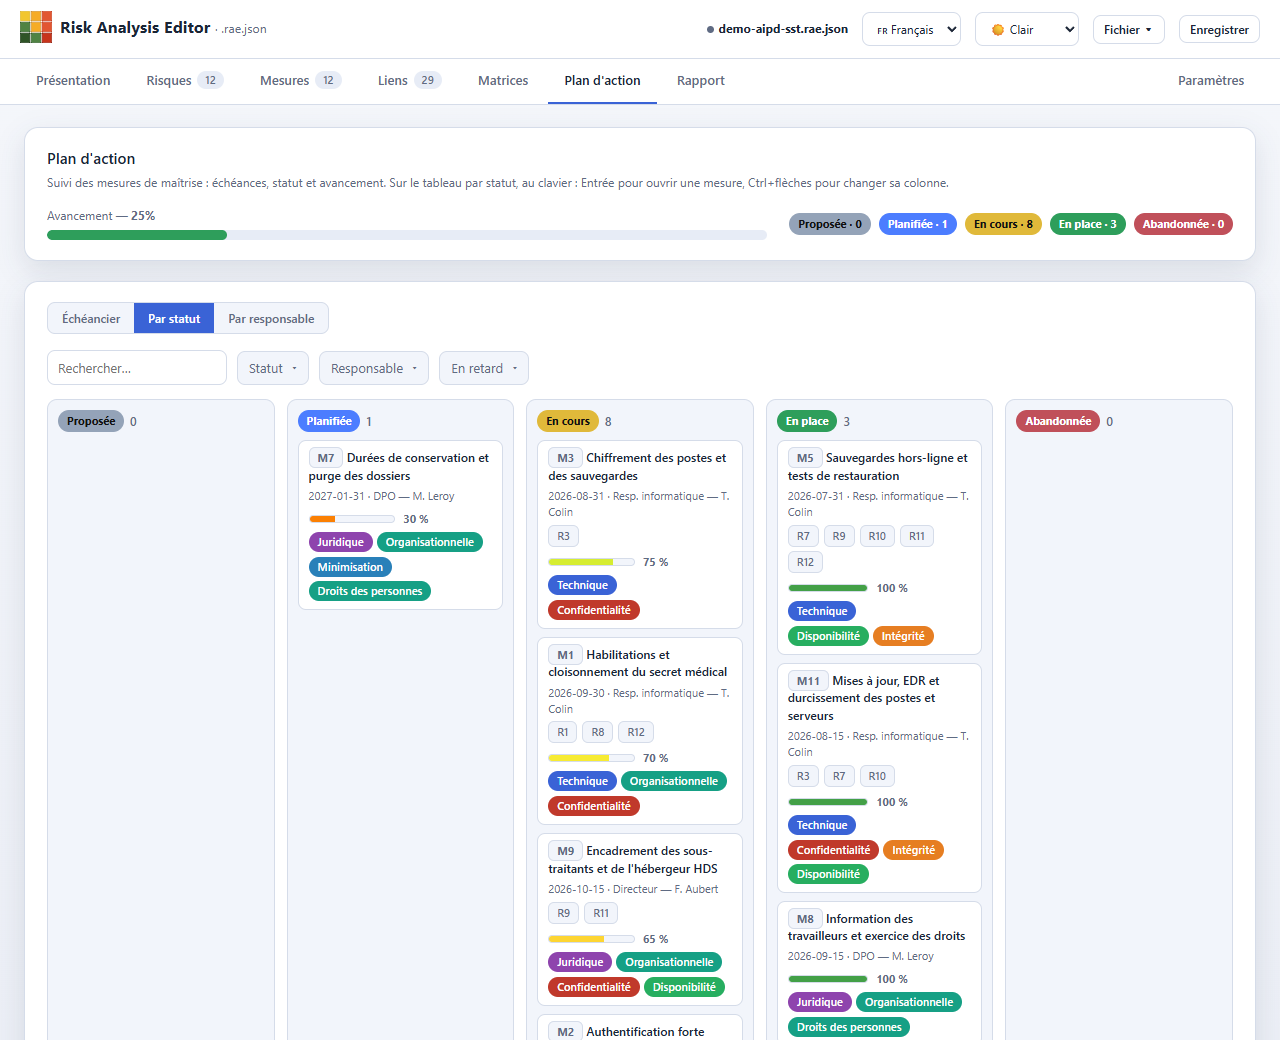
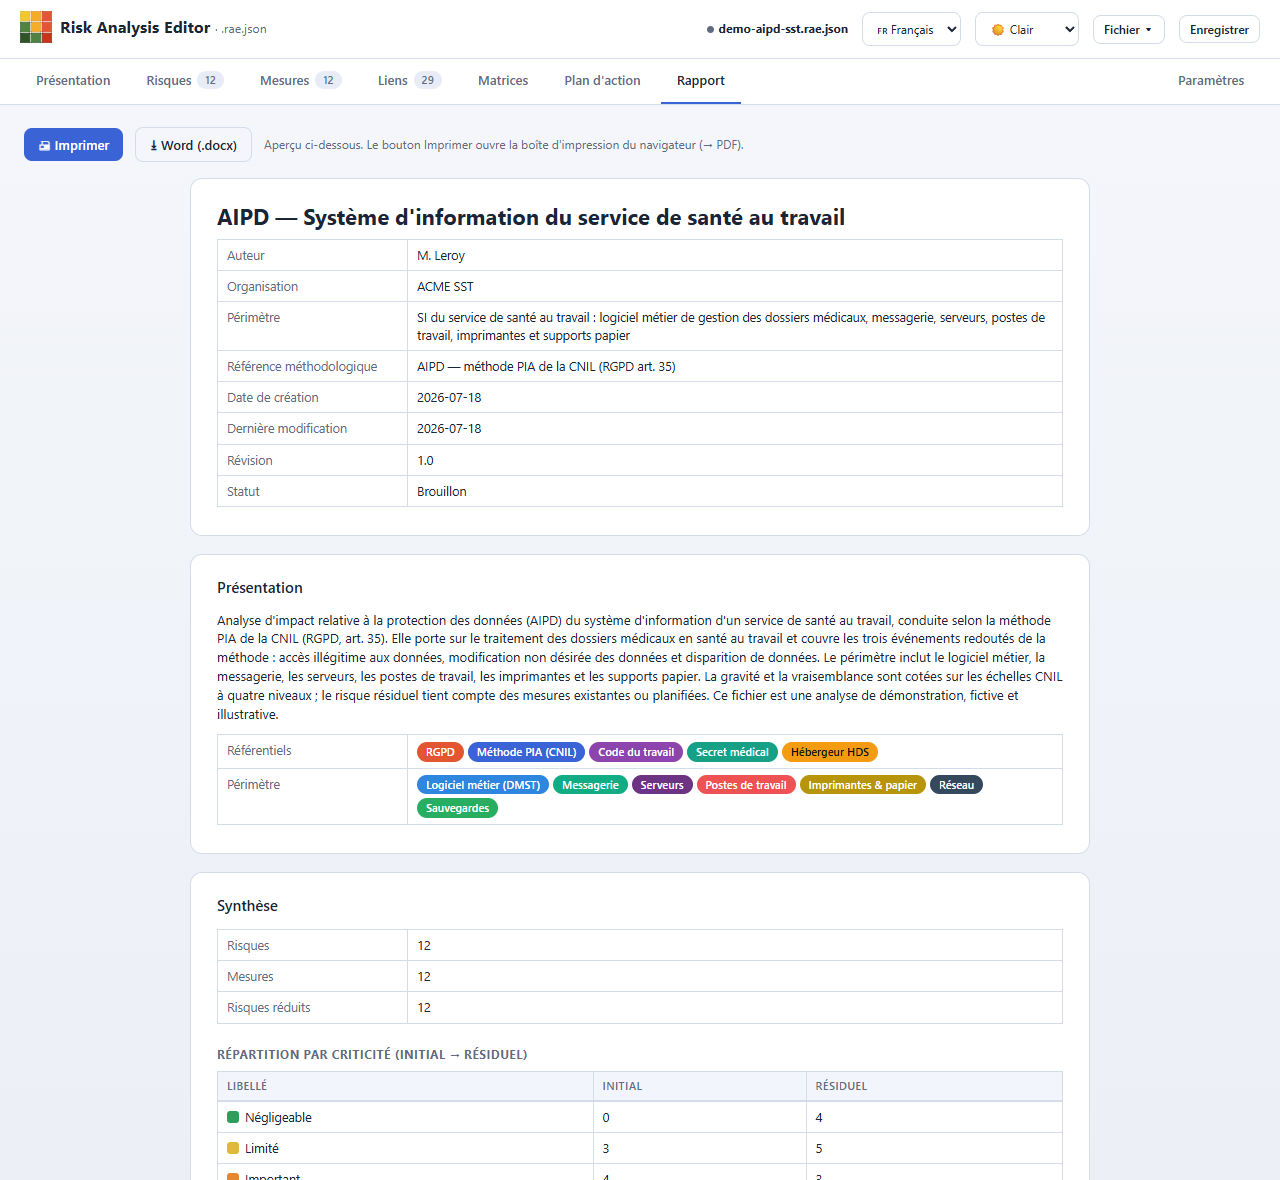
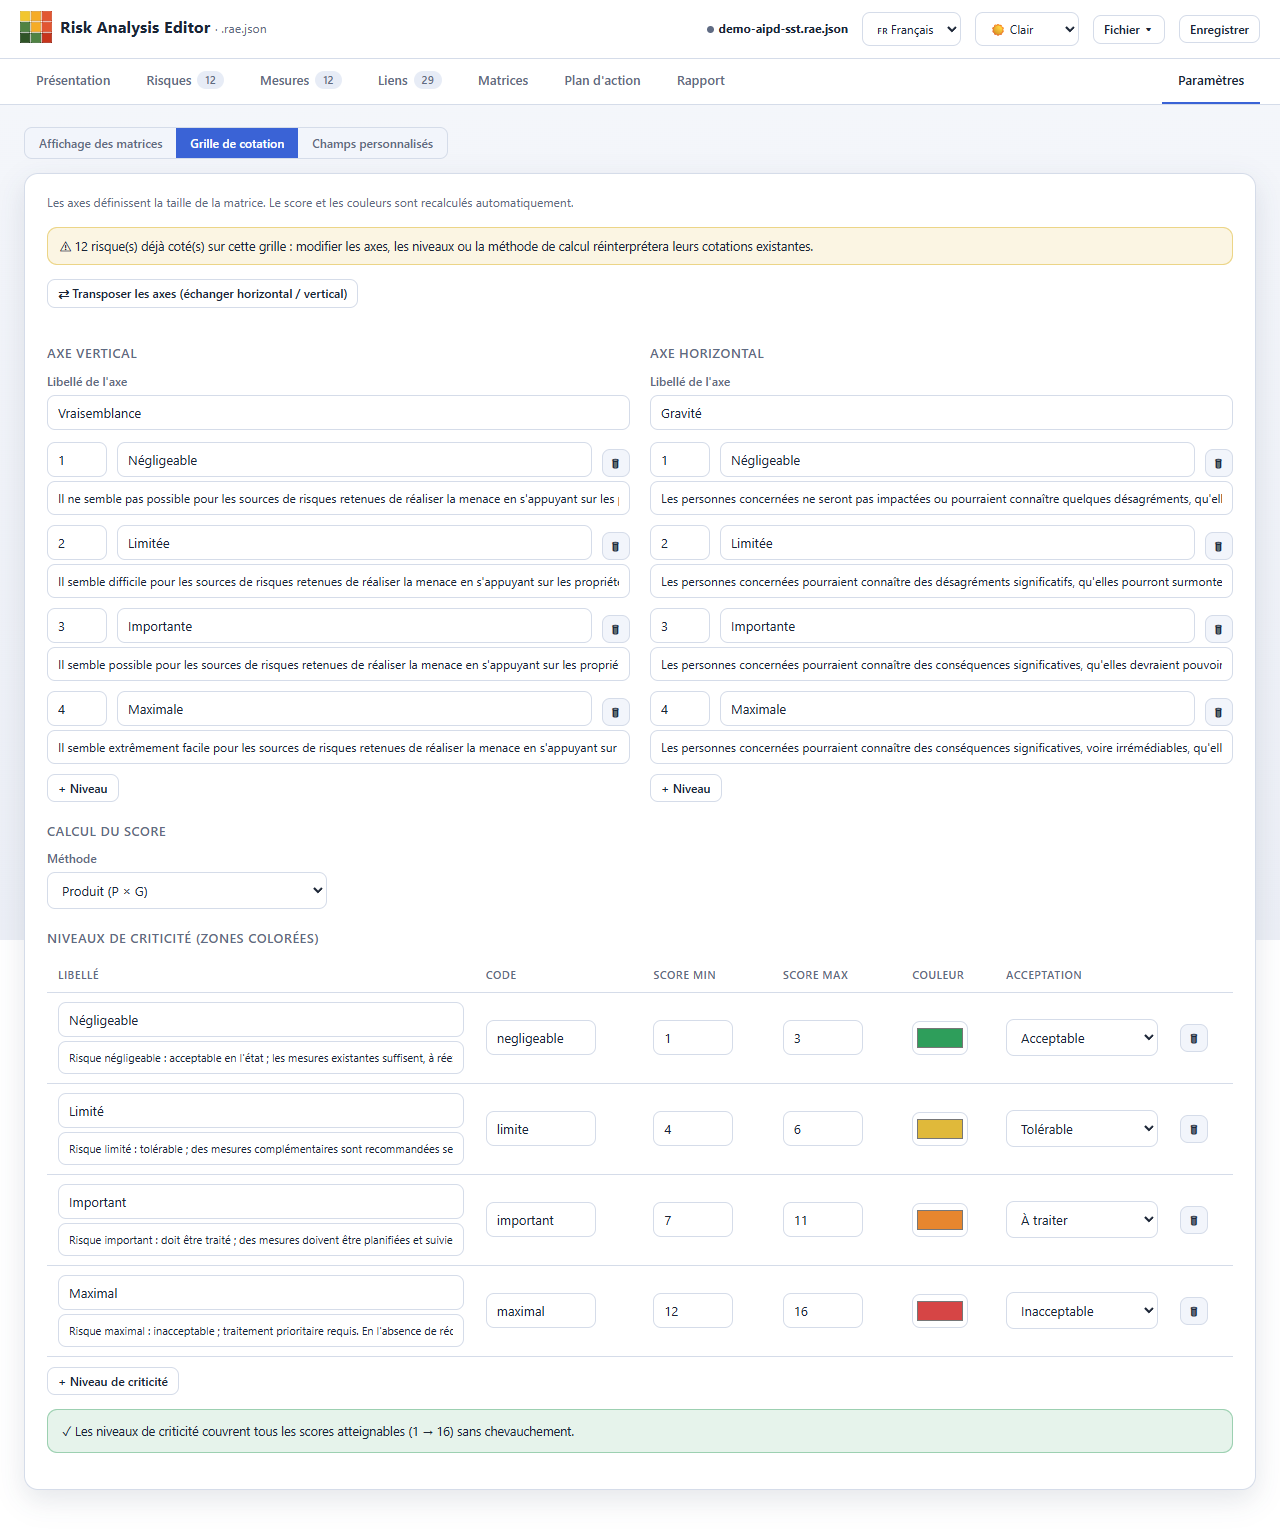
From grid to report, in a single tool
Configure the grid, identify and score, treat, visualize, track and publish – without leaving the tool.
Standalone & offline
A single HTML file, no external resource at runtime, no server. Open the analysis with a double-click; the app emits no data over the network.
Generic, configurable model
Tailored grid: free axes and levels, product / sum / cell-by-cell matrix scoring, criticality zones, custom fields.
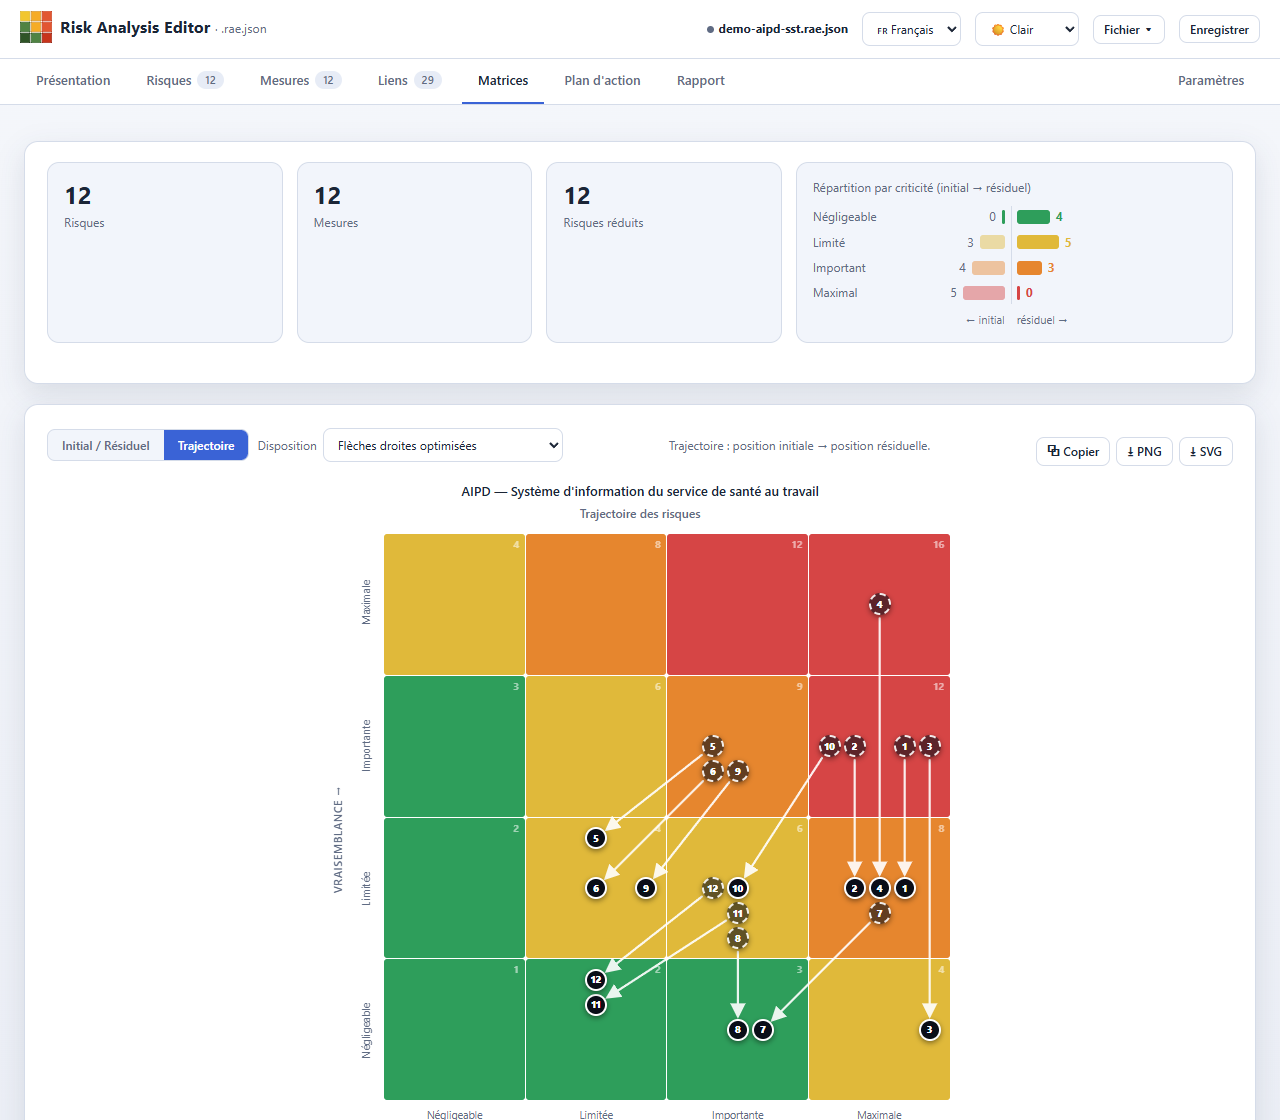
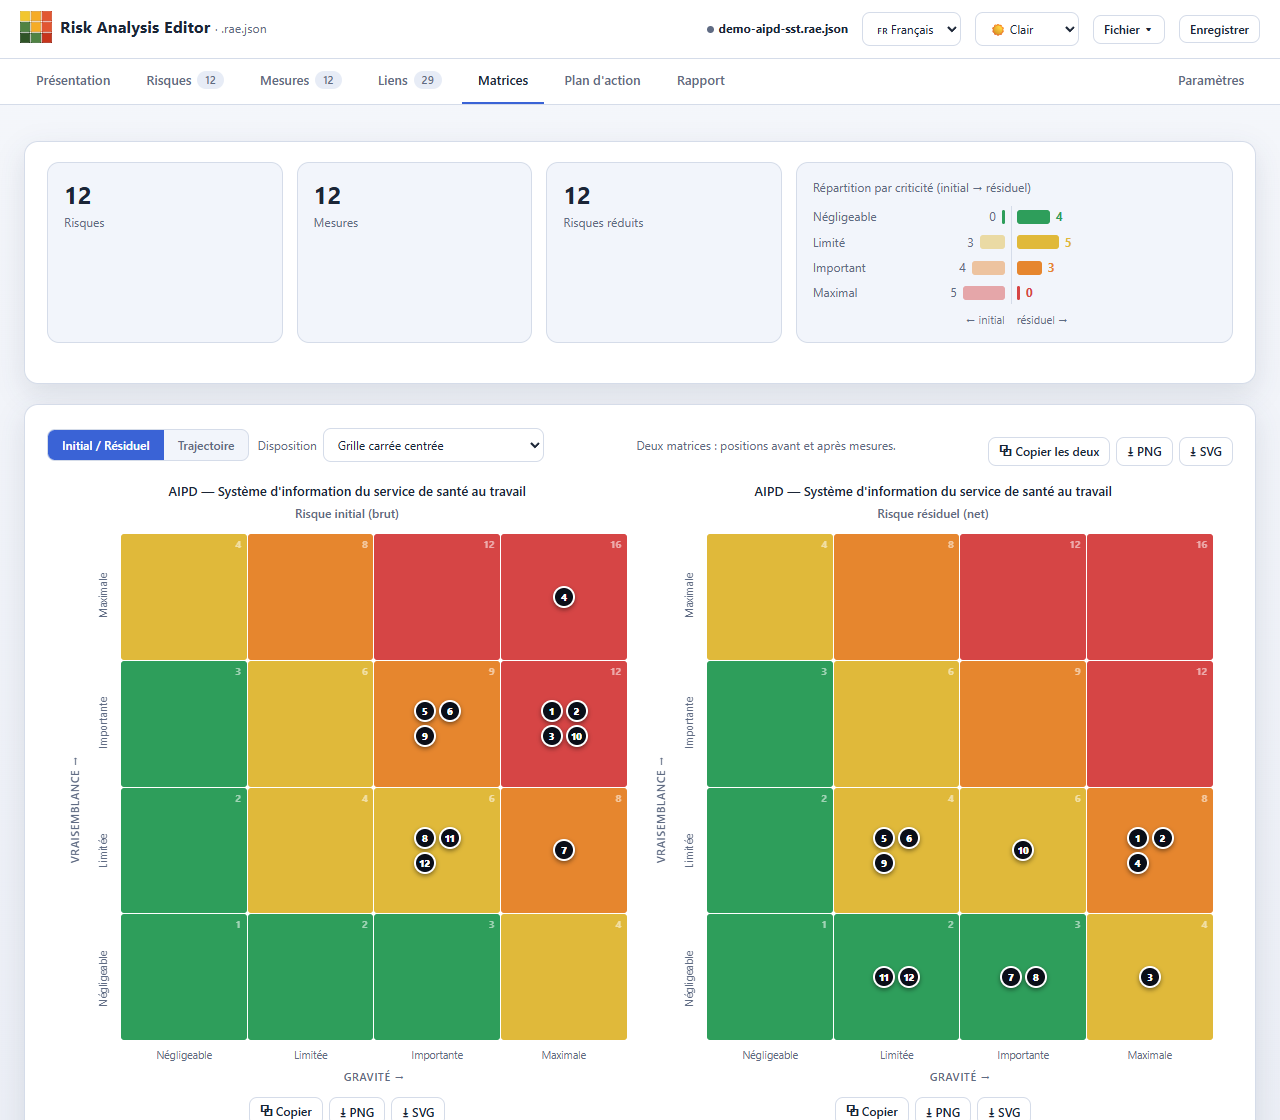
Matrices & trajectories
Inherent/residual matrices and arrowed trajectories, multiple layouts, manual placement, PNG and SVG exports.
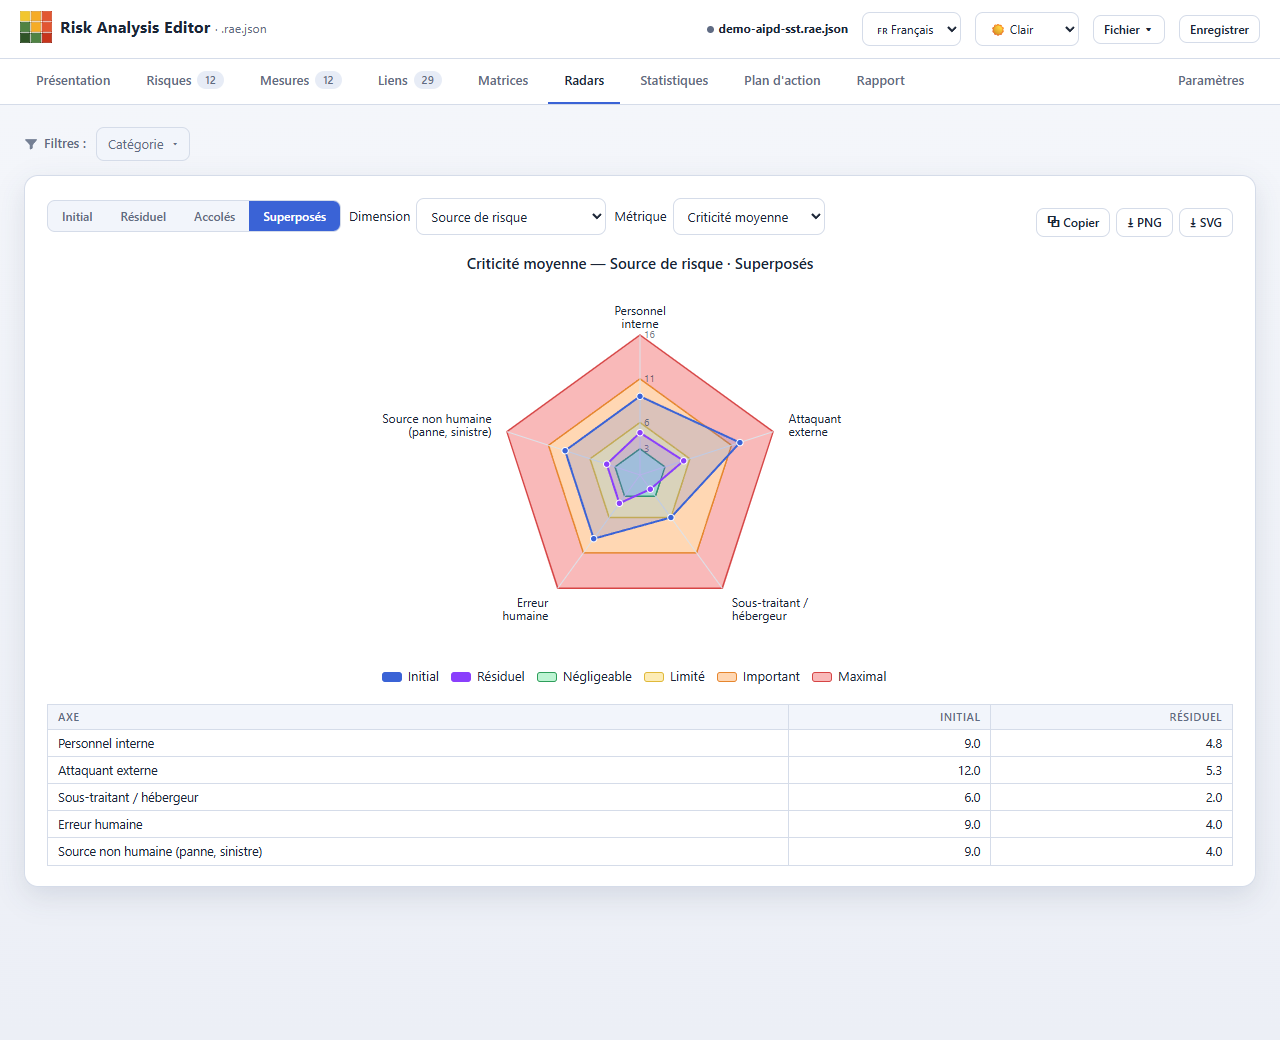
Radars
Risk profile as a spider chart by category or custom field, several metrics, inherent vs residual overlaid, PNG and SVG exports.
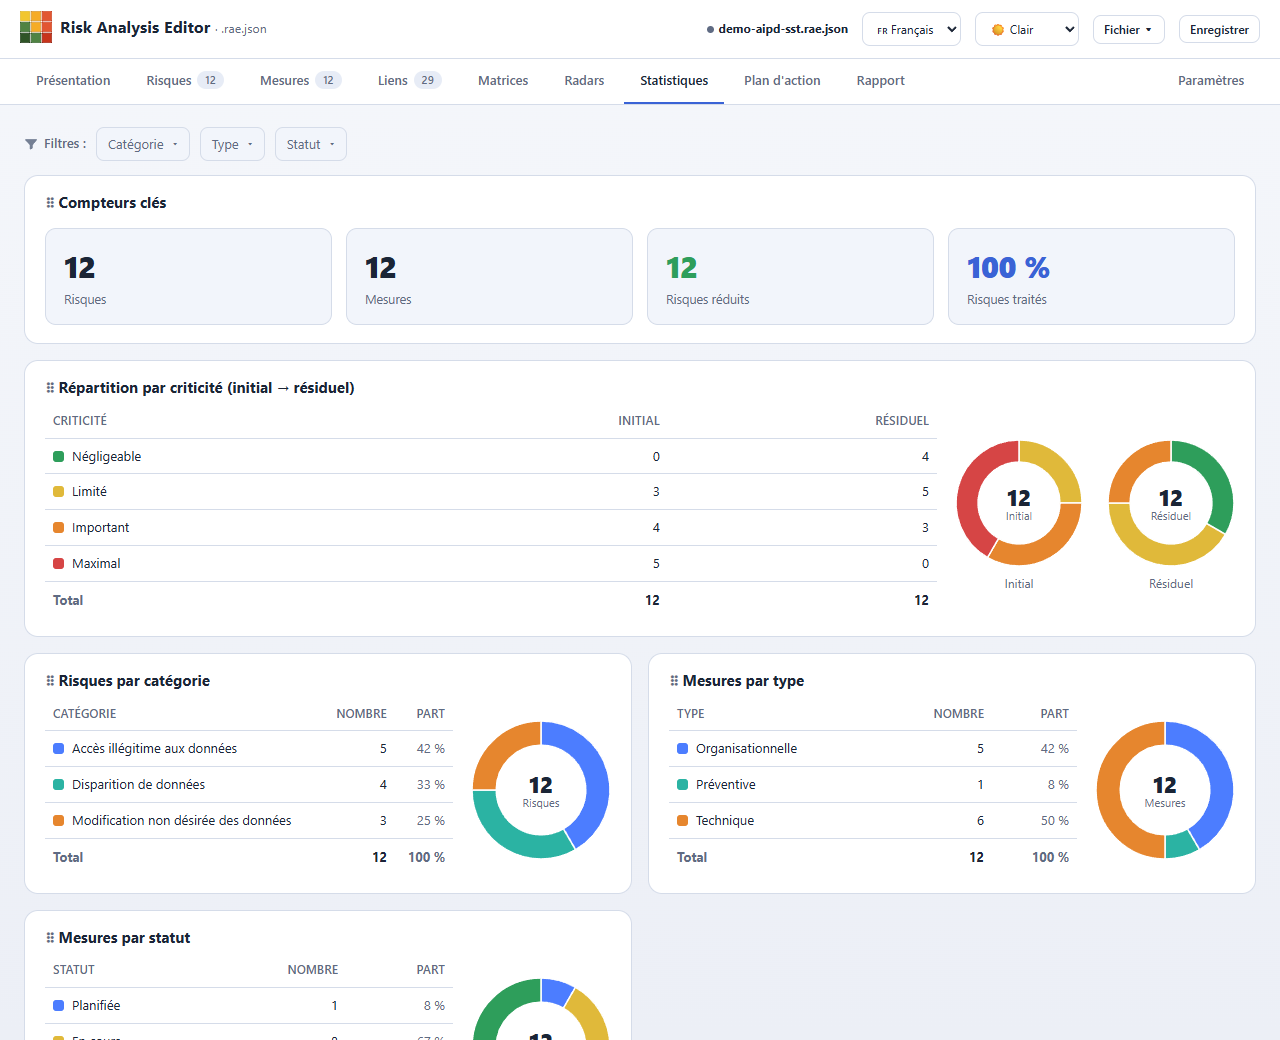
Statistics
Key counters, distributions by criticality, category, type and status, and coverage (risks without a control, orphan controls) — as tables and charts.
Open format
The .rae.json is documented, with a JSON schema for validation. CSV import/export, plus Word and Excel exports generated locally.
Word reports in your layout
Fill your own .docx template: {{ … }} tags become your data — tables, matrices, radars, charts — without touching your layout.
Filtering & customization
Filters applied to the whole analysis, from risks, measures and links through to the matrices and the report. Customizable column display and order.
Tracking & deliverable
Action plan (timeline, kanban, by owner), progress and overdue tracking, printable report, ready to share or print.
Your Word reports, in your own layout
Prepare a Word document in your own style — logo, styles, cover page, layout — drop in a few tags, and the app fills it with your analysis data. The result keeps exactly your formatting: nothing to rework afterwards.
- Tables, matrices, radars and charts inserted exactly where you decide.
- Repeating lists, a chapter per category or per risk, sections that appear only when relevant.
- Ready-to-use templates, each with an annotated version, plus a writing guide.

One tool, several roles
The same generic core serves very different approaches, with starter templates ready to adapt.
DPIA – risk part, inspired by the CNIL PIA
Run the risk part of a data protection impact assessment: feared events, severity × likelihood, existing and planned controls.
- Starter DPIA template
- 4×4 grid in the CNIL spirit
- Printable report, to include in your file
EBIOS RM · ISO 27005
Score, treat and visualize your risk scenarios. Start from a template and adapt the grid to your scale.
- Starter templates inspired by EBIOS RM and ISO 27005
- Sources, supporting assets, effects as custom fields
- Before / after trajectories
Your own method
A highly configurable probability × severity matrix, without the weight of an enterprise GRC suite.
- Tailored grid and criticalities
- Custom fields (10 types)
- Sharing via a single file
Open a demo analysis in one click
Two fictional demo analyses, ready to explore in your browser.
Information system
An EBIOS RM–inspired risk analysis: risk sources, scenarios, controls and trajectories.
Occupational health service
The risk-analysis part of a DPIA: feared events, controls and report.
Learn by video
Step-by-step tutorials — build, explore and customise a report — subtitled and dubbed in French, English and Italian.
No account, no server, no upload – even the Word and Excel exports are generated in your browser.
Ready to try?
Open the app, or download the single file to work offline.